Drug-Drug Interaction Visual Analytics (DIVA)
Stakeholder - U.S. Food and Drug Administration (FDA) . 2017-2018Project Goal
To design a visual analytics tool that helps FDA analysts in detecting adverse reactions caused by drug-drug interactions (DDI).
Project Scope
Team
My Role
Problem
Multiple drugs taken together can cause adverse drug reactions due to drug-drug interactions (DDIs). These adverse reactions cost 100,000 deaths
and $170 billion annually in the U.S. alone.
Currently, at the FDA, drug safety evaluators detect adverse reaction signals by analyzing large number of
adverse event reports.
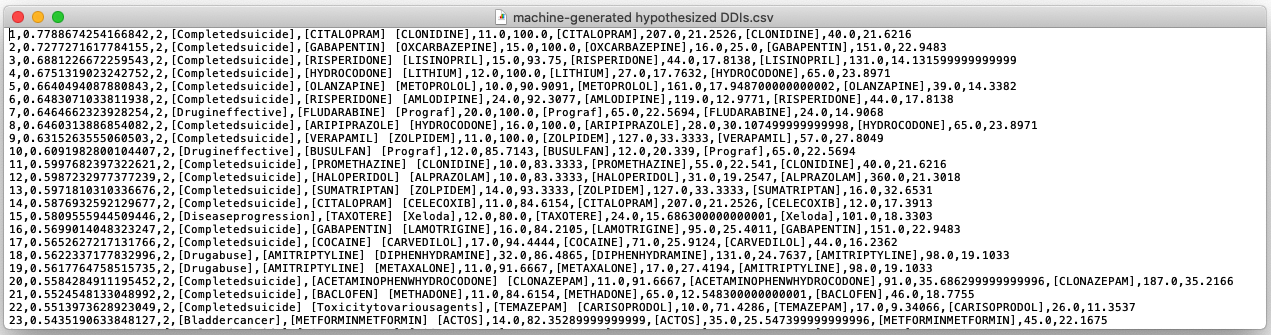
Machine learning applied to these reports generate even a larger number of DDI signals that are difficult to interpret and are hypotheses about potential signals that need human validation.
My goal is to design an interactive visualization tool (DIVA) that aligns with the drug safety review workflow to support the analysis of these hypothesized drug-drug interaction (DDI) signals.
User Research
Target Users
Our users for DIVA are drug safety evaluators at the Division of Pharmacovigilance at the FDA who are responsible for the detection adverse drug reactions (signals).
Key Research Questions and Areas
- How drug safety reports are analyzed?
- What are the key challenges users currently face?
- Observe and understand users' current review process.
Methodology
The user research took a total of two weeks and included the following activities with five users.
- Week 1 (Phase 1). 45 minutes remote interviews to get an overview of their workflow.
- Week 2 (Phase 2a). 30 minutes contextual inquiry to observe users at work.
- Week 2 (Phase 2b). 30 minutes in person interviews for follow-up discussion and clarification.
User Workflow for Signal Detection
Based on our interviews in Phase 1, the drug safety review workflow is summarized below.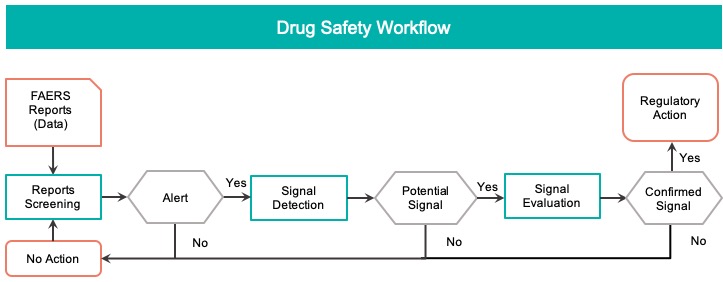
Users' Priority During Report Analysis
"I first look for reports with a serious outcome such as death or hospitalization."
"If it is a designated medical event (DME) or rare reaction, I will open that report."
"We review direct reports as a priority, as we are the first ones to look at them."
Affinity Diagram to Categorize Users' Needs
Based on the user research, an affinity diagram was created to identify and group users' needs and concerns.
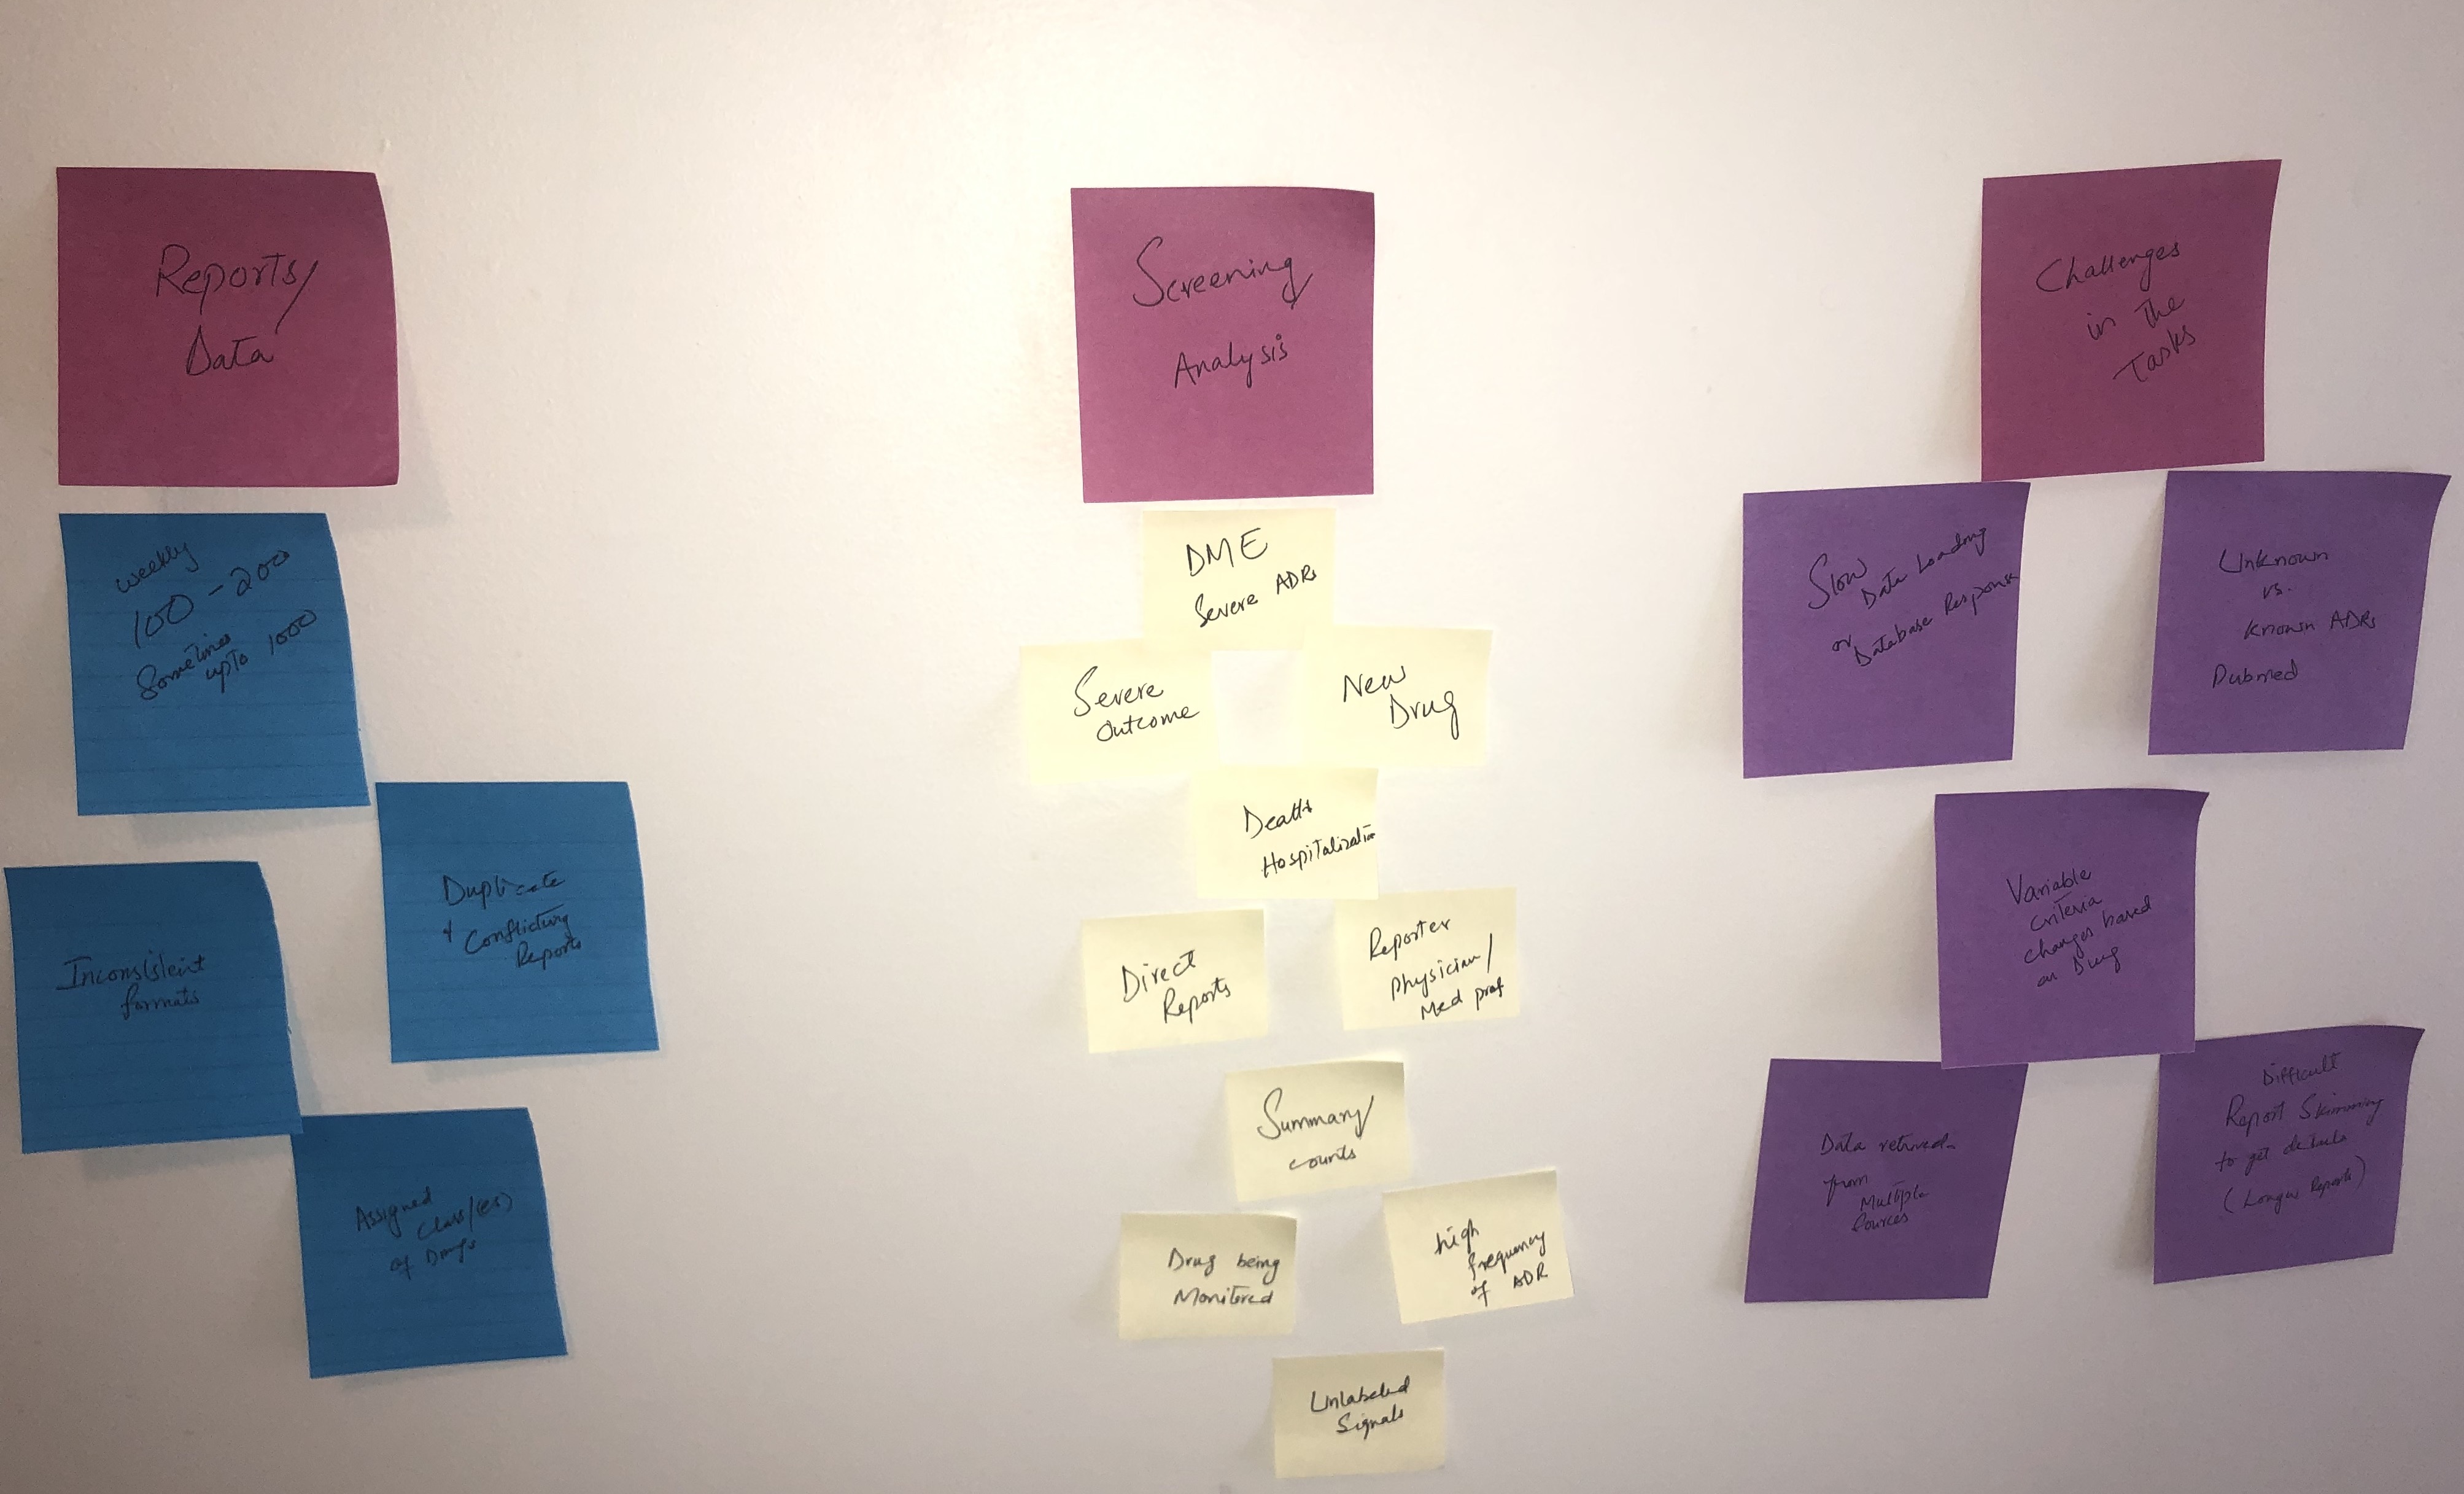
Key Findings from User Research
Based on the user research, the following features were identified as high priority for the visual analytics to help in the analysis of the DDI signals.
- Provide an overview of all DDI signals.
- Allow analysts to segment and prioritize signals.
- Integrate information about previously known (discovered) signals.
- Facilitate identification of unknown (undiscovered) signals.
- Facilitate identification of severe adverse reactions.
- Access to raw reports supporting the signals.
Design Process
DDI Signals Data to be Visualized
Based on our user research, we integrated domain knowledge into an already complex DDI signal generated by machine learning. The final data model to be visualized consists of the following elements.
- The two interacting drugs (DDI).
- A set of adverse reactions associated with the DDI.
- A numeric score (machine learning metric) that represents the significance of the signal.
- Domain knowledge about the signal status being known or known.
- Domain knowledge about the signal having a severe reaction (DME).
Literature Review
To start, we reviewed academic research papers and other published best practices for designing visualizations for machine-learning output and drug related information. In addition to the required features, we learned some best practices and guidelines for designing multiple coordinated views - such as details on demand, selecting chart types based on the data and task, and direct manipulation of data.
Visual Design and Prototypes to Get User Feedback
Given the complexity of the DDI signals and user tasks, designing a single visualization is not feasible. Based on literature review and heuristic analysis of different visualization techniques for the underlying data, we considered various visualizations.
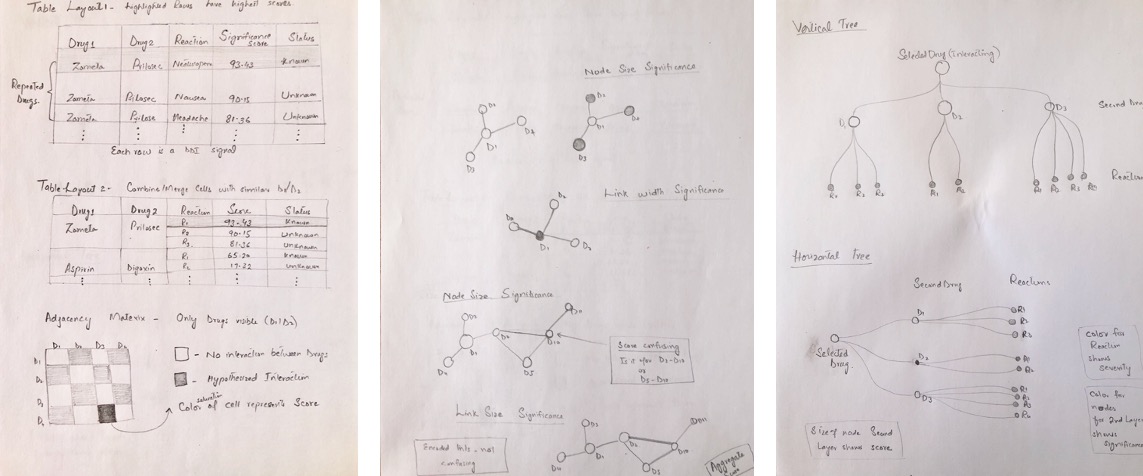
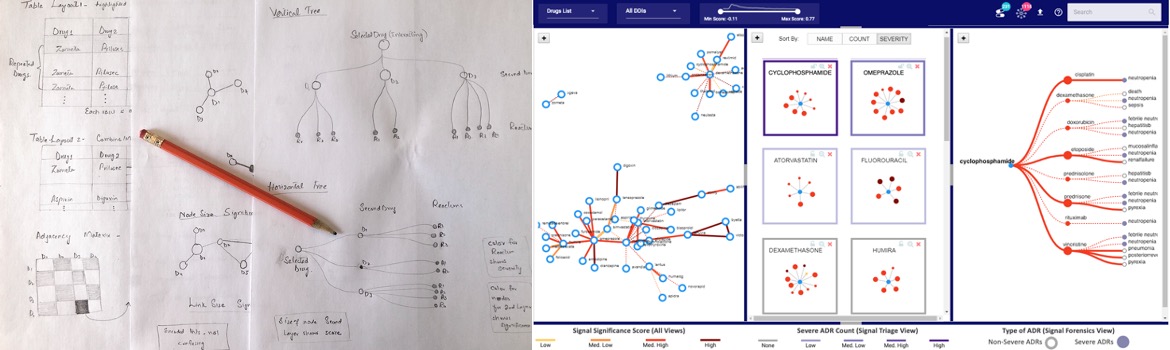
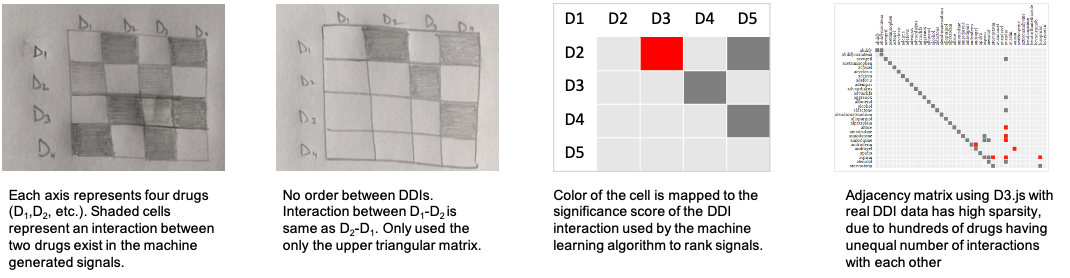
To help users explore the set of all the machine-generated drug-drug interactions (DDIs) the first suitable candidate is an Adjacency Matrix (below figures). Due to sparsity of the matrix for real data, alternatively, a node-link diagram is designed.
In the node-link diagrams (following figure), the nodes are mapped to the drugs and the links depict the interaction between drugs. The visual encodings, i.e., color and size of
the links (Screening view) and nodes (Triage view) are mapped to the significance score of the signals and status of the reactions, respectively.
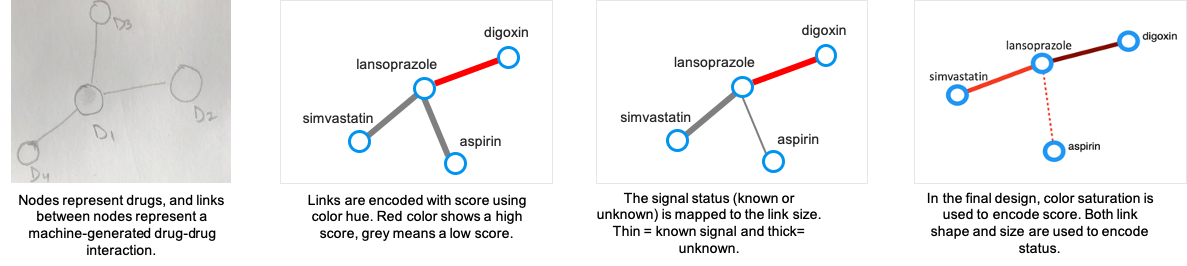 The node-link design for all the views are iteratively refined to choose the most suitable visual encodings
for mapping the underlying signals data.
The node-link design for all the views are iteratively refined to choose the most suitable visual encodings
for mapping the underlying signals data.
Final Visual Design
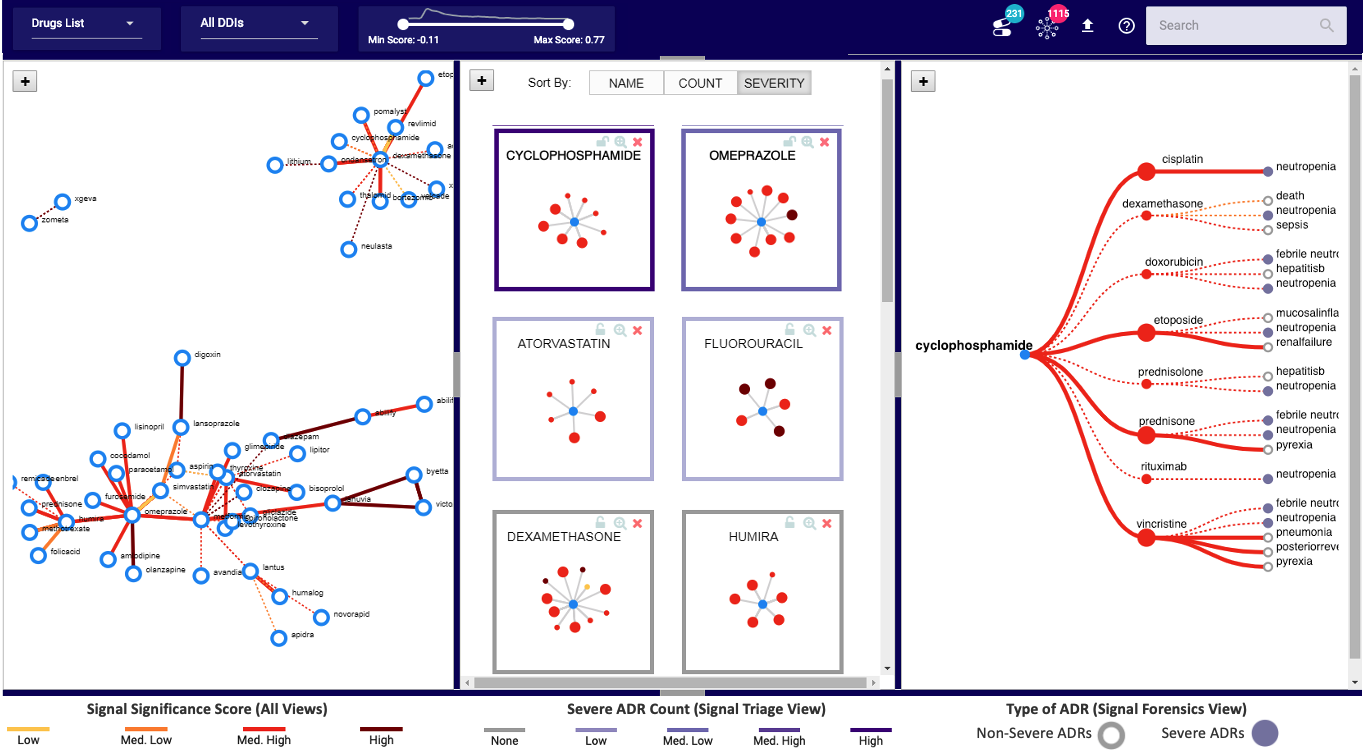
DIVA (shown below) consists of three coordinated views to help with the drug safety tasks.
The Screening View (Left) gives an overview of all hypothesized DDI signals supporting a user in screening unknown and
high scored signals. Each node is a drug and link represents an interaction between the drugs.
The Triage View (Middle) displays all the drug interactions associated with a particular
drug (depicted as middle blue node). It helps users prioritize a drug for review based on its intearctions.
The Forensics View (Right) uses a tree diagram that includes adverse reactions (third layer of nodes) related to each
drug-drug interaction for further exploration. The purple color is used to highlight severe reactions.
Validation - DIVA Helps in Quick Detection and Validation of Signals
For evaluation, case studies followed by brief interviews were conducted with ten users at the FDA.Case Study
This case study demonstrates the effectiveness of DIVA in interpretting and identifying interesting DDI signals generated by machine learning that need validation.
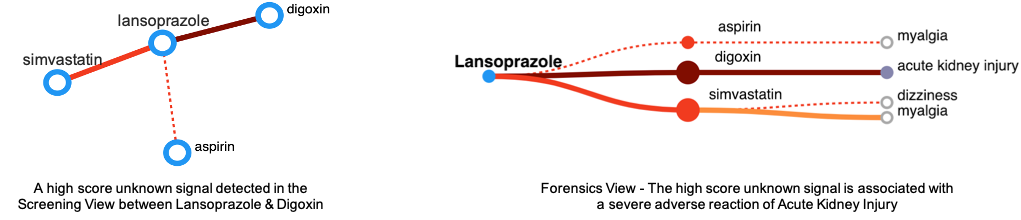
During exploration of DIVA, the user identifies Lansoprazole with a high scored (dark color) unknown interaction with Digoxin in the Screening view. The user investigates this DDI further in the Forensics view
and notices a serious reaction (Acute Kidney Injury).
Upon reviewing the reports, the user discovers that other drugs taken by the patient in these reports might be the underlying
reason for this severe reaction.
Positive Feedback from Users
"It is easy to differentiate DMEs [serious reactions] from non-DMEs [non-serious] through the highlights, as compared to reading the list or trusting one's memory."
"Having the ability to highlight interesting and highly scored signals is very effective in narrowing down our investigation."
"This has not been done before, it is very useful and aligns with our workflow."
Takeaways
- DIVA is a step towards making machine-learning adaptable to the novice users.
- DIVA is effective in identifying and validating critical adverse reactions caused by drug-drug interactions.
- DIVA is an easy and intuitive approach to improve drug-safety process by using interactive visualizations.
Next Steps
- Adding drug classes to group signals associated with drugs in the same class to reduce clutter.
- Integration of domain knowlege such as including the symptoms for which drugs were taken.
I learned that iteration is the key for designing questionnaires for user interviews, visualizations, as well as interactions.
Read More
For more details on this problem and the design process, please read this publication.